RUBBER MOTORS ON TEST
Bench tests using an electronic counter enable Wakefield expert RON WARRING to give a new slant on an old subject with emphasis on the respective merits of “straight” or “geared” rubber motors.
Extravagant claims have been made concerning the respective merits of “taut” and ” slack” motors. There has been a certain amount of practical evidence to support the idea that a rubber motor which is supported between hook distances equal to its unstretched length, delivers more power- two typical examples being that a simple helicopter model performs best with a taut motor (a longer motor needing a greater cross section for equivalent performance); and also Wakefields with” taut” motors, either geared or long-fuselage single skein type, apparently have a better performance. In the writer’s experience, for example, a geared Voodoo (Zombie development) out-performs a single skein Voodoo with the same weight and cross section of rubber. Climb is markedly better, motor run longer and height reached greater. Yet against these practical results is the thought that the same weight of rubber motor, however used, should be capable of delivering the same, or nearly the same, amount of useful work or energy.
Pretty obviously the answer would not come from flight test data alone. There are far too many variables, not the least being the improbability that flight time is an exact measure of true performance at anyone time. In other words, flight duration alone is no acceptable standard for comparison, owing to the variable” weather” element. Flight performance is, of course, still the “end product”, as it were. If enough flights are made in relatively still conditions it is soon quite easy to judge the still air performance of any particular model.
Over, say, five or six flights of an evening, and without altering the trim, a given number of turns should consistently produce the same flight time on the majority of occasions. Any marked differences may be put down to the air sinking or rising at the time of that particular flight. Yet there are some evenings when the air is consistently rising slightly, just as on other evenings the reverse conditions may apply. Thus a single evening’s test results may be misleading, even if the air is apparently “dead”. The more”still air” flying you do the nearer you can get to consistent figures, but the whole business is a very lengthy process.
Consistent test results, therefore, are more likely to come from indoor experiments, measuring the actual power output of the motor instead of the flight performance of the model. The classic method of doing this, of course, is to measure the torque with an apparatus something like that sketched in Fig. 1 which gives instantaneous readings of torque as the motor is unwinding. Some experimenters vary this by winding on a certain number of turns a test reading, letting off a counted number of turns, stopping the propeller and taking a second reading, and so on.
The second method is open to several objections. In the first place it does not simulate true working conditions. Torque output, in a model in flight, is given by an unwinding motor and this may be quite different from that of the same motor with the turns let out step~by-step.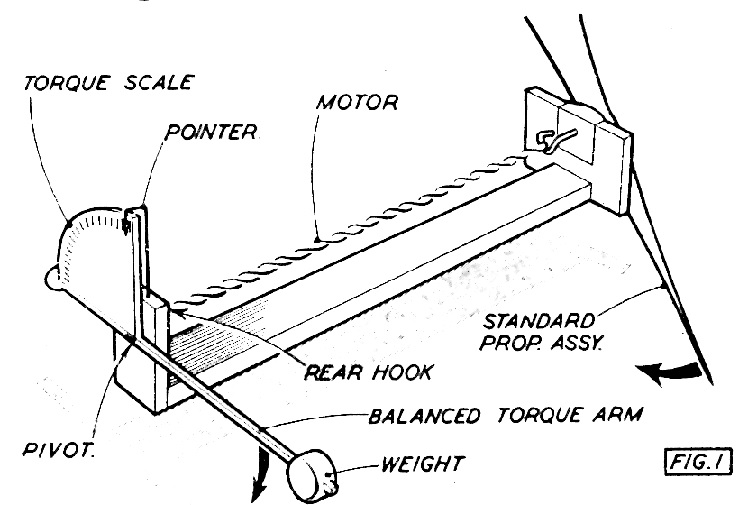
The normal torque curve of an unwinding motor is shown in Fig. 2, representing, say, the motor wound to 1,000 turns and torque readings taken every 5 seconds as the motor is unwinding all the time. Suppose, now, the same motor is wound to 500 turns and the test repeated. The second curve will not start at the “500 turn” mark on the previous curve, but at a very much higher level, tapering off into the original curve, as shown by the dotted line. Other tests at different turns would give a series of similar curves. 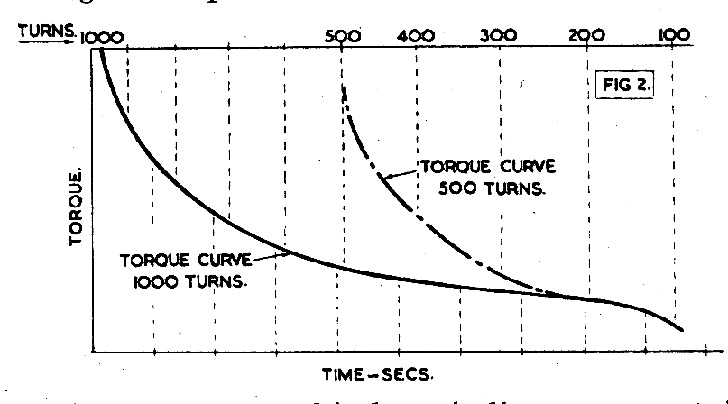
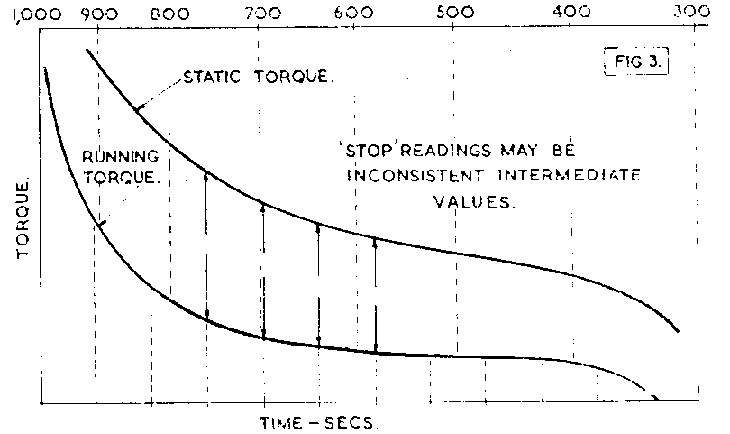 The step-by-step method is measuring not the torque output of the motor under working conditions, but a series of initial torques on these various curves-or some intermediate value between the two-so that the curve plotted-Fig. 3-is of doubtful value.
After trying gears for the first time in July 1951 and obtaining (apparently) “something for nothing” from the motor, the writer determined to test out this set-up on the bench. The original reason for the adoption of gears was not in seeking a “better” or “improved” power output but merely to eliminate bunching troubles with a 4-oz. motor by halving it taut between hooks. In a fuselage of conventional length, return gears were the logical solution.
It was fairly obvious that the existing torque testing apparatus was not particularly suited for dealing with a return-gear system. Hitherto all torque readings had been made off the rear end of the unwinding motor with a standard propeller assembly on the front end of the motor. Adapted for gears the test rig would have to take the form of Fig. 4, which would not necessarily duplicate working conditions with motors in the model.
There was also another aspect of the problem.
Gears run in a series of short bursts-not because of their friction but because one end of a rubber motor unwinds differently to the other end. A number of tests with a marker bound in the middle of a rubber motor showed that the centre of the motor unwound erratically-just like the gears burst into action and then stop. The implication was that measuring the torque at the rear end of the motor may not exactly duplicate the torque applied to the propeller shaft, i.e., the force rotating the propeller and generating thrust.
It was finally decided that measurement of the speed of rotation of the propeller was the best solution, since this could be done without putting any load at all on the system. by using a light beam and a photo-electric cell. Since the problem had entered the realm of electronics, co-operation of the Hook brothers of R/C fame was enlisted, they assuming responsibility for the design and construction of the electronic rev. counter.
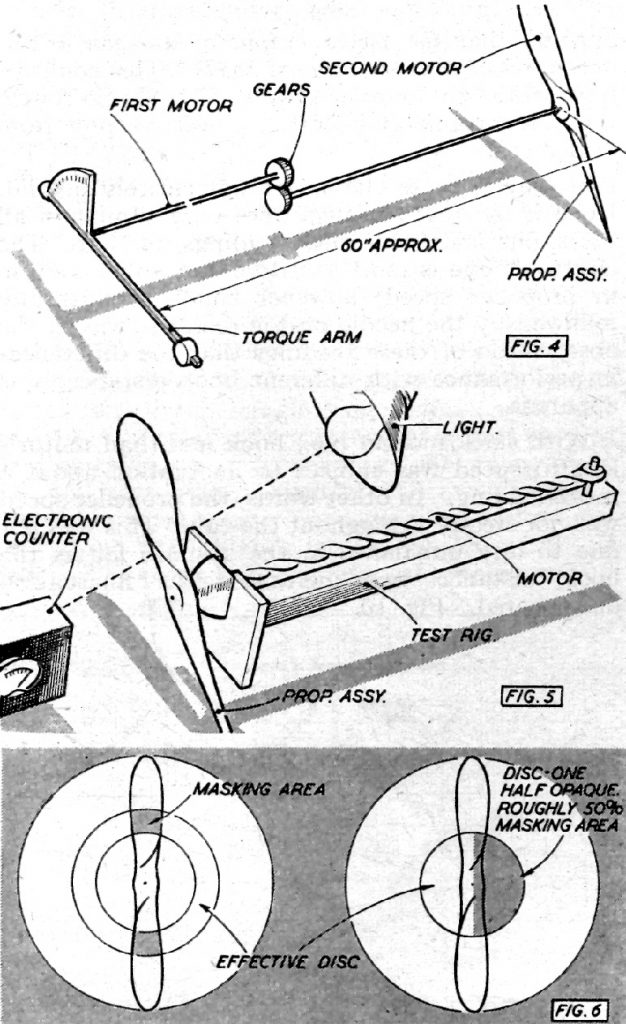 The apparatus is shown simply in Fig. 5. The counter itself is a small self-contained unit which is placed just in front of the· propeller. Behind the propeller is a suitable light source (a torch was satisfactory, although actual tests were made with a 100-watt lamp) shining into the photocell “window”. The propeller and motor assembly was quite separate and could be of almost any form -e.g. even a standard fuselage. The apparatus counted the frequency with which the light beam was interrupted by the revolving propeller blades and registered speed as a simple micro-ammeter scale reading. Scale readings were related to actual r.p.m. by a series of check tests with constant speed discs.
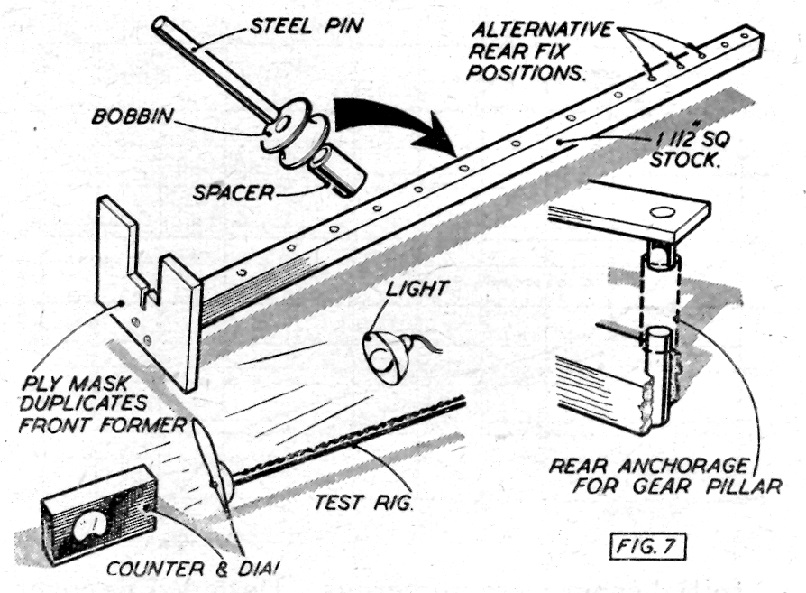
Initial snags were numerous. Designed to cover a specific range of speeds (roughly 15 revs. per sec. down, as representative of Wakefield propeller performance), giving a top scale reading at maximum speed and as near as possible a linear scale, both parties forgot, for a start, that at 10 revs. per sec., for example, the actual time of interruption of the light beam was extremely small because the masking area-i.e., the blade width-represented only a small proportion of the actual disc area-Fig. 6. As a result the counter became very critical as regards the quality and position of the light source when measuring the higher speeds. If his was not just right, then it registered nothing at all on the dial. A lot of time was wasted trying to overcome this failing until the obvious answer of fitting a small disc to the propeller itself-one half blackened and the other half clear-occurred. This completely cured the original sensitivity and made every part of the apparatus non-critical as regards adjustment. And since the same disc attached to the same prop. was used throughout the tests, any effect this disc had on propeller performance can safely be ignored. In actual fact it probably has no effect at all as far as propeller speed is concerned for static running. The final test apparatus is then shown in Fig. 7.
The beam is marked off with a series of “hook distances”, drilled to take a steel pin at each of these points, to which the rear bobbin of the test motor, or gear assembly, can be located. Speed was read off as micro-ammeter readings and translated into r.p.m. by reference to a calibration graph.
Test Results
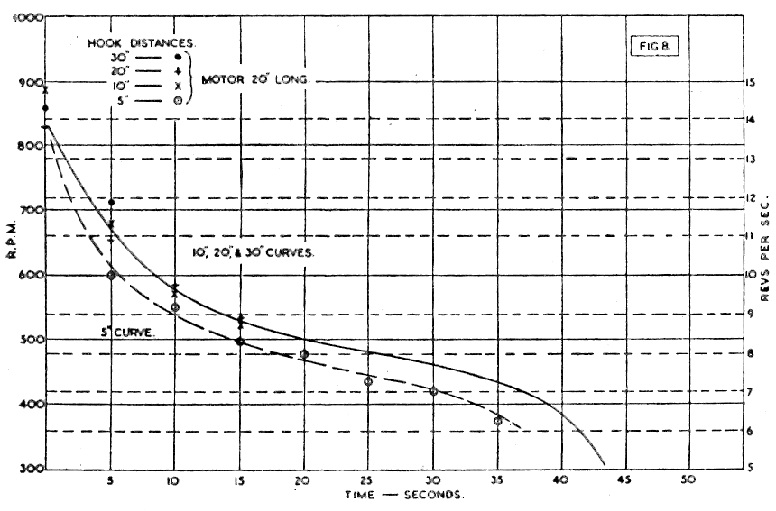
The first series of tests have now been completed and make interesting reading. The test motor was 20 ins. long, comprised of 14 strands of Pirelli 1/4-in. strip rubber, as typical of Wakefield practice. Power output, as represented by the speed at which it turned the propeller, was determined at hook distances of 5, 10, 20 and 30 ins. Provision was made for testing at closer intervals, but this was not done for reasons which will be obvious.
All motors were wound to the same number of turns, this number of turns being the maximum possible consistent with no fatigue. In other words, well broken-in rubber was used and the test runs used were the highest possible consistent with a control motor on separate tests showing identical power output over a number of tests, wou~d to this figure, tested, wound once more, tested, and so on. The turns figure possible was 20 turns per inch, i.e., 400 turns on the 20-in. test motor,
Now the result of these tests is plotted out in graphical form in Fig. 8. Except for one, performance is virtually the same. The exception is where the hook distance is 5 ins. or one quarter the length of the motor. Here the wound motor is so cramped and knotted that a definite slowing up is apparent. Within reasonable limits, however, it appears that the power output of a motor is independent of distance between hooks. This could be represented by another graph-Fig. 9. So much, then, for claims for better power output from taut motors.
However, these claims are not entirely invalid.
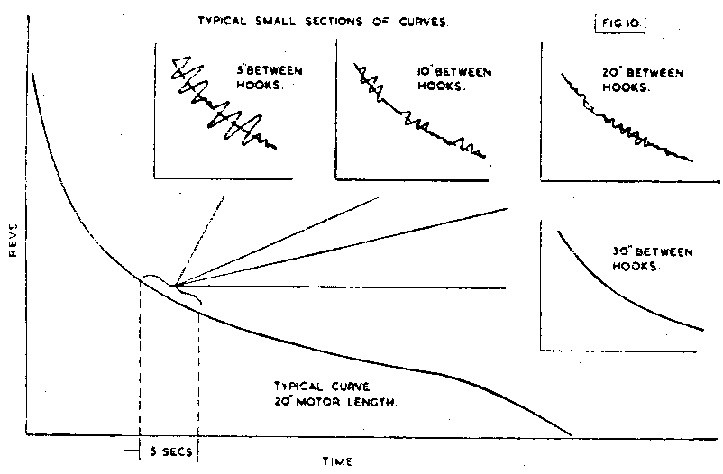
Even if the test readings were very similar in all cases, one feature of these readings was not. The electronic eye is most sensitive and any variation in propeller speed, however small, is faithfully followed by the needle on the dial. It was in the observation of these readings that the differences in performance with different hook distances was apparent.
With slack motors (i.e., hook less than motor’s length) speed was subject to fluctuation about a mean reading. In ‘other words, the propeller speed was not steady throughout the run. This was not due to any unbalance in the system, for as the hook distance was increased this fluctuation disappeared. Fig. 10.
The taut motor is very nearly smooth running – not exactly so, but much smoother than the same motor on shorter hook distance. When the hook distance is still further increased so that the motor is actually tight between hooks, all unevenness eventually disappears. This is realised at a hook distance of approximately 1·25 times the motor length – Fig. 11.
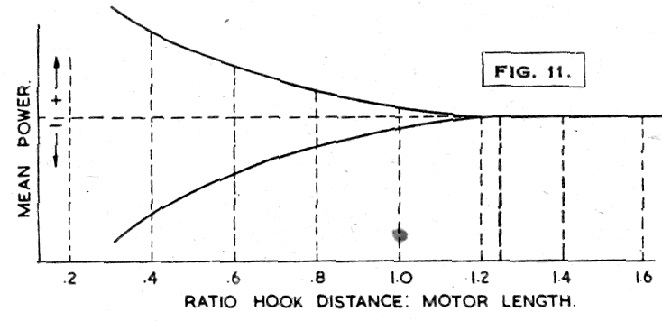
This gives a clue to the answer of the original problem. Any advantages offered by a taut motor are most certainly due to its smoother running characteristics. Power output, as such, is substantially the same. What almost certainly does occur-and this is a feature beyond the scope oi the present tests-is that the shorter the distance between hooks the more uneven the unwinding of the motor.
Even if the motor does not bunch in the accepted sense, the same thing appears to take place in a smaller scale all the time with slack motors. This would account for those otherwise inexplicable “poor” performances to which the best of rubber models are subjected at times.
The inference is, of course, that a model with taut motors should be more consistent and the writer’s own experience with geared models seems to bear this out. Or, alternatively, the greater the ratio motor length:hook distance, the more care necessary to avoid bunching, such as anti-bunch fittings and very careful winding technique.
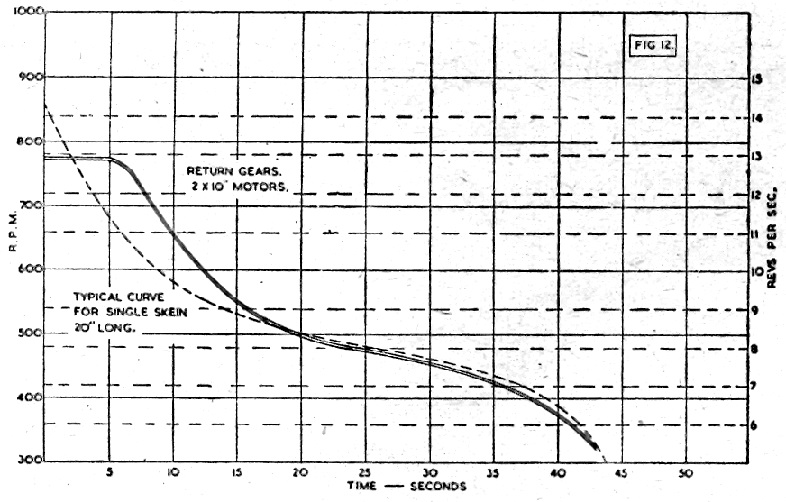
The remaining tests were made with a geared motor-the 20-in. single skein motor split into two 10-in. motors with a return gear unit as used in a model, and now wound to 200 turns each, i.e., 400 turns total, as before. This was to give a direct comparison between single skein and return gear drive performance which was known to be different from practical flying performance.
Perhaps starting with an impression of what was thought would be the difference led to rejection of the first test, but subsequent tests confirmed the initial readings. Fig. 12.
The initial part of the output curve is now completely modified and no longer have we the characteristic “torque curve” which drops sharply, tapers off to a flattish portion and then dies away again. Initial power output is definitely lower and for more than five seconds on every test remained at a constant figure. After that the curve drops away again, but slowly, and eventually merges, more or less, with the single skein curve.
Now this is most interesting, for it implies a constant power output for the initial part of the flight, with an initial power of less than that of a single skein motor. In other words, it should be easier to control and also give a most definite improvement in climb over the first fifteen seconds or so. Remember, here, the test motors were short, and if the same curves were reproduced for, say, 30-in. motors, improved climb characteristics for up to fifty seconds might be expected. Towards the end of the power run the geared drive seems to give rather less power than a single skein motor.
It must also be remembered that these tests were conducted with “straight” motors, i.e., the single skein motor was not tested in the corded condition, this being the subject of some further tests. What it does indicate, however, is that with taut motors, geared return provides a better initial power run than the same length of motor between hooks in a long fuselage.
One question the test with the geared drive did solve – the effects of the “spurts” of power as the gears cut in periodically, feeding the bottom motor into the top one. As far as propeller speed is concerned there is no acceleration. What happens is that from an initial steady reading speed begins to waver slightly, as indicated by the dial needle. Quite suddenly the gears cut in and immediately the speed is dead steady once more, to repeat the process throughout the power run – Fig. 13. 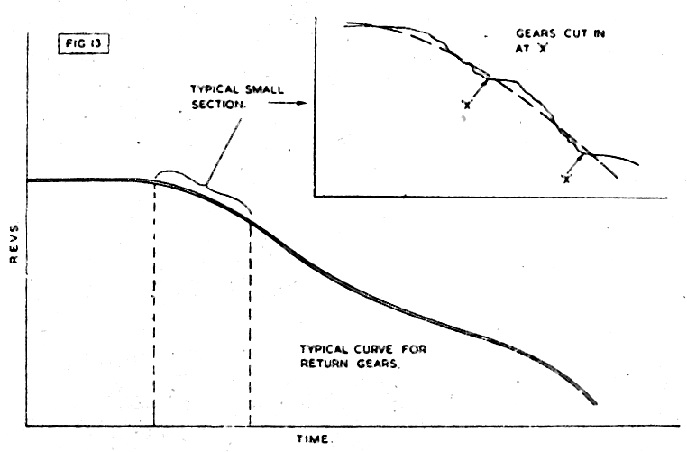 The gear feed does, as previously surmised, produce a “stepped” power run, but no increase in propeller speed as the gears come in. Particularly over the first part of the power run the propeller speed is more appreciably constant than with a single skein drive, and then descends in a series of steps.

